Terahertz Non-Destructive Evaluation of Corroding Paint Layers
The non-destructive evaluation technique is to reflect terahertz pulses (THz time-domain spectroscopy or also called THz Pulse Imaging) from a multilayer paint stack as shown in the image below. Usually, the paint layers are so thin that the various reflected pulses overlap with each other (figure b below).


By measuring the TOTAL terahertz reflectivity, one may easily distinguish where blisters form on the paint sample due to advanced corrosion. The figure below is a time sequence of a sample exposed to salt-fog spray and humidity cycling corrosion protocol. The digit in each panel refers to the number of weeks of corrosion. The bottom right figure is a visible picture of the sample after 14 weeks of corrosion. Note that the presence of the tape around the edges of the sample is readily apparent in the terahertz images. The corrosion is initiated at the cut-edge boundaries of the sample. The salt-fog spray is able to 'seep' around the taped edges! Dark regions in the terahertz images indicate the presence of 'blistering' of the paint layers.

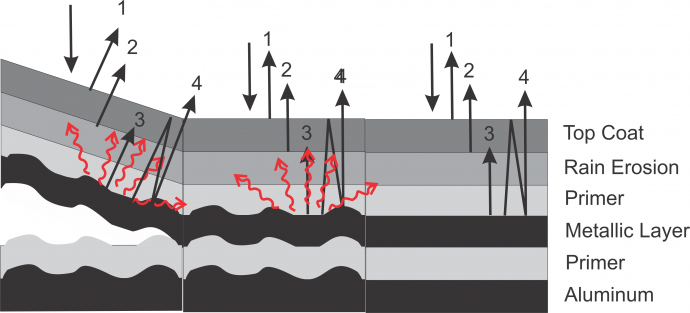
An illustration of the results of the corrosion process is shown in the figure below. Prior to the onset of corrosion, Terahertz radiation is reflected from the boundaries of materials. As corrosion is initiated, the dielectric pain layers remain intact but the corrosion of the metallic layers leads to a roughening of the metallic surfaces. The increase in roughness leads to increased scattering of terahertz radiation from the metallic layer and a reduction of detected reflected terahertz radiation from the metallic layer. Further corrosion causes the paint stack to detach (eg. blister) from the substrate. The numbers by the arrows indicate the 4 most prominent reflections in the terahertz waveform.
The amplitude and timing of the terahertz reflections from each layer are determined by performing a deconvolution of the reflected terahertz waveform with a reference waveform. Typical terahertz waveforms and the corresponding deconvoluted peaks are shown in the figure below.


The utility of terahertz nondestructive analysis is its ability to detect the initial onset of corrosion beneath the paint layers prior to visible evidence of blisters on the surface. This is accomplished using terahertz radiation by sensing the change in roughness due to corrosion. In order to examine the difference in the onset of corrosion-induced roughness and detachment of the paint layer stack, slice C of the figure above is analyzed to extract the surface height of the paint layer and the deconvoluted peak 3 amplitude (corresponding to the reflected amplitude from the metallic layer). The local height of a bulging blister may be calculated by measuring the time difference between the arrival time of a pulse reflected from an area with no bulge and an area with a bulge. The figure below contains two vertical dashed lines. The left most vertical line signifies the pixel position at which the surface height (black line) begins to increase due to blistering on the surface of the sample. The right most dashed vertical line indicates the location for which the peak 3 amplitude begins to decrease. The pixel positions between the two vertical dashed lines indicate the region on the sample for which the roughness reduces the reflected Pulse #3 amplitude (gray line) from the metallic layer, but the bulging blister is not yet visible on the surface of the paint stack. This suggests that the reduction in the 3rd pulse amplitude may be an early indication that this area of the paint stack will soon detach from the substrate and create a visible blister on the sample surface.
