2020 Archive
Sunday, June 7, 2020
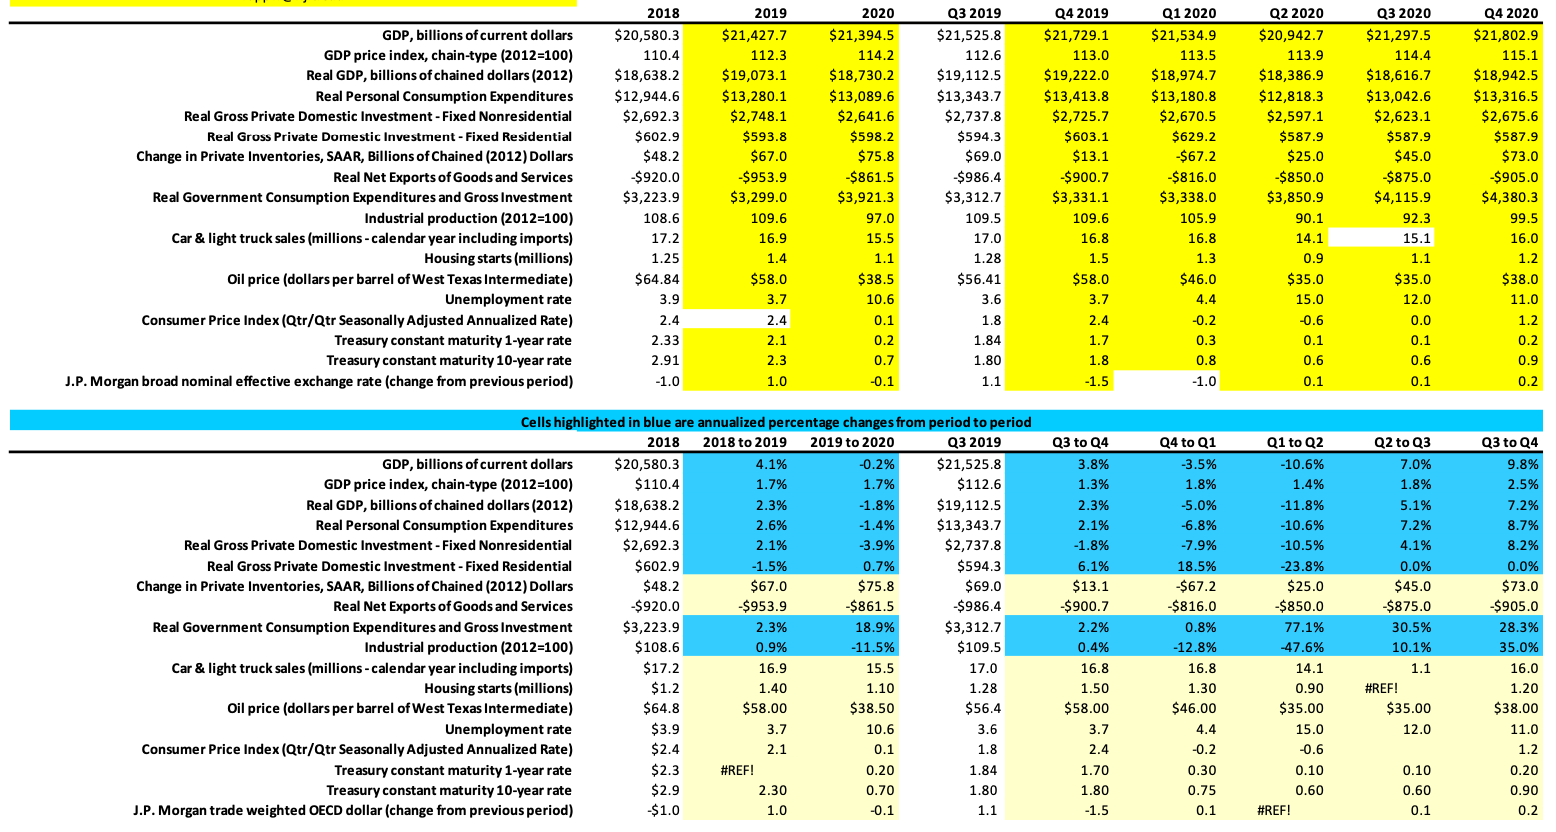
Second Revised 2020 US Economic Forecast
In my first revised US Economic Forecast at the beginning of April, I was way too optimistic, i.e. not pessimistic enough. Firms such as Morgan Stanley were a lot closer to what was happening and likely going to happen. I just predicted a two-quarter downturn [Recession] with a U-shaped bottoming out beginning in the 3d quarter and a reasonable pick-up in the fourth quarter. What has emerged is much worse than that and I have updated both the actual results and my forecast for the remainder of the year, though everything remains in flux and is highly uncertain, much being dependent on both a vaccine and a treatment for the COV-19 virus and their timing.
At the same time one needs to be careful with the data, particularly with respect to unemployment. So, while 40 million plus have applied for benefits since March only 25 million, still a very big number, are continuing to collect benefits, meaning others have either left the labor force, including retirement, or have found jobs. The latter would be consistent with reports that firms such as Amazon, Walmart and CVS have hired hundreds of thousands of people along with cities and states hiring workers to staff unemployment centers or virus contact trackers. The unemployment numbers I have used in my new revised forecast reflect these developments.
Forecasts by their nature incorporate a lot of assumptions. In this case one of the most important is the shape of the downturn and any recovery. Currently there are three primary cases vying for acceptance with one having two possible variations. The first is a V-shaped or Rocket recovery beginning in June and July that reflects an almost full return to “normal” economic activity in the very near future. Certain members of the Administration cling to this quite unlikely development. The second view which has been promoted by several asset managers is a U-shaped recovery starting with a leveling out of the economy [no further decline and perhaps a slight uptick in growth] in the third quarter. In turn the fourth quarter would show significant growth extending into the first quarter of 2021 along with a widely administered vaccine.
The third option which has been suggested by the Federal Reserve and is incorporated into my forecast is the Nike Swoosh or sharp downturn in the second quarter with a gradual pickup in the third and fourth quarters. The reason I favor this scenario is that people are being more cautious about their lives and well-being in returning to work or venturing forth to stores and travel destinations than desired by many politicians and businesses that appear more interested in seeing the economy opened and returned to normal, which is a true oxymoron, than they are in the health and welfare of constituents, workers, or customers. However, some moderate expansion in economic activity seems to be occurring with appropriate precautions as lockdowns end in several important economic hubs.
In true Adam Smith fashion, the invisible hand of individual actions will in the aggregate drive the economic recovery. Therefore, I expect that a more normal functioning economy awaits a widely administered and effective treatment and vaccine but meanwhile, people will work, travel and shop more only to the extent they feel it can be done safely. On this basis, since most experts think a vaccine solution will not be until the first quarter of next year, my forecast sees only a moderate recovery through year end and we will still not be back to where we were at the end of 2019. Further, while unemployment will better than now it will still be over 10%.
Even this forecast however could turn out to be overly optimistic if there is a modified Swoosh development from a second COV-19 wave or combined second wave with a normal flu cycle in the fourth quarter. I will try to keep everyone apprised as the situation continues to unfold.
Tuesday, April 7, 2020
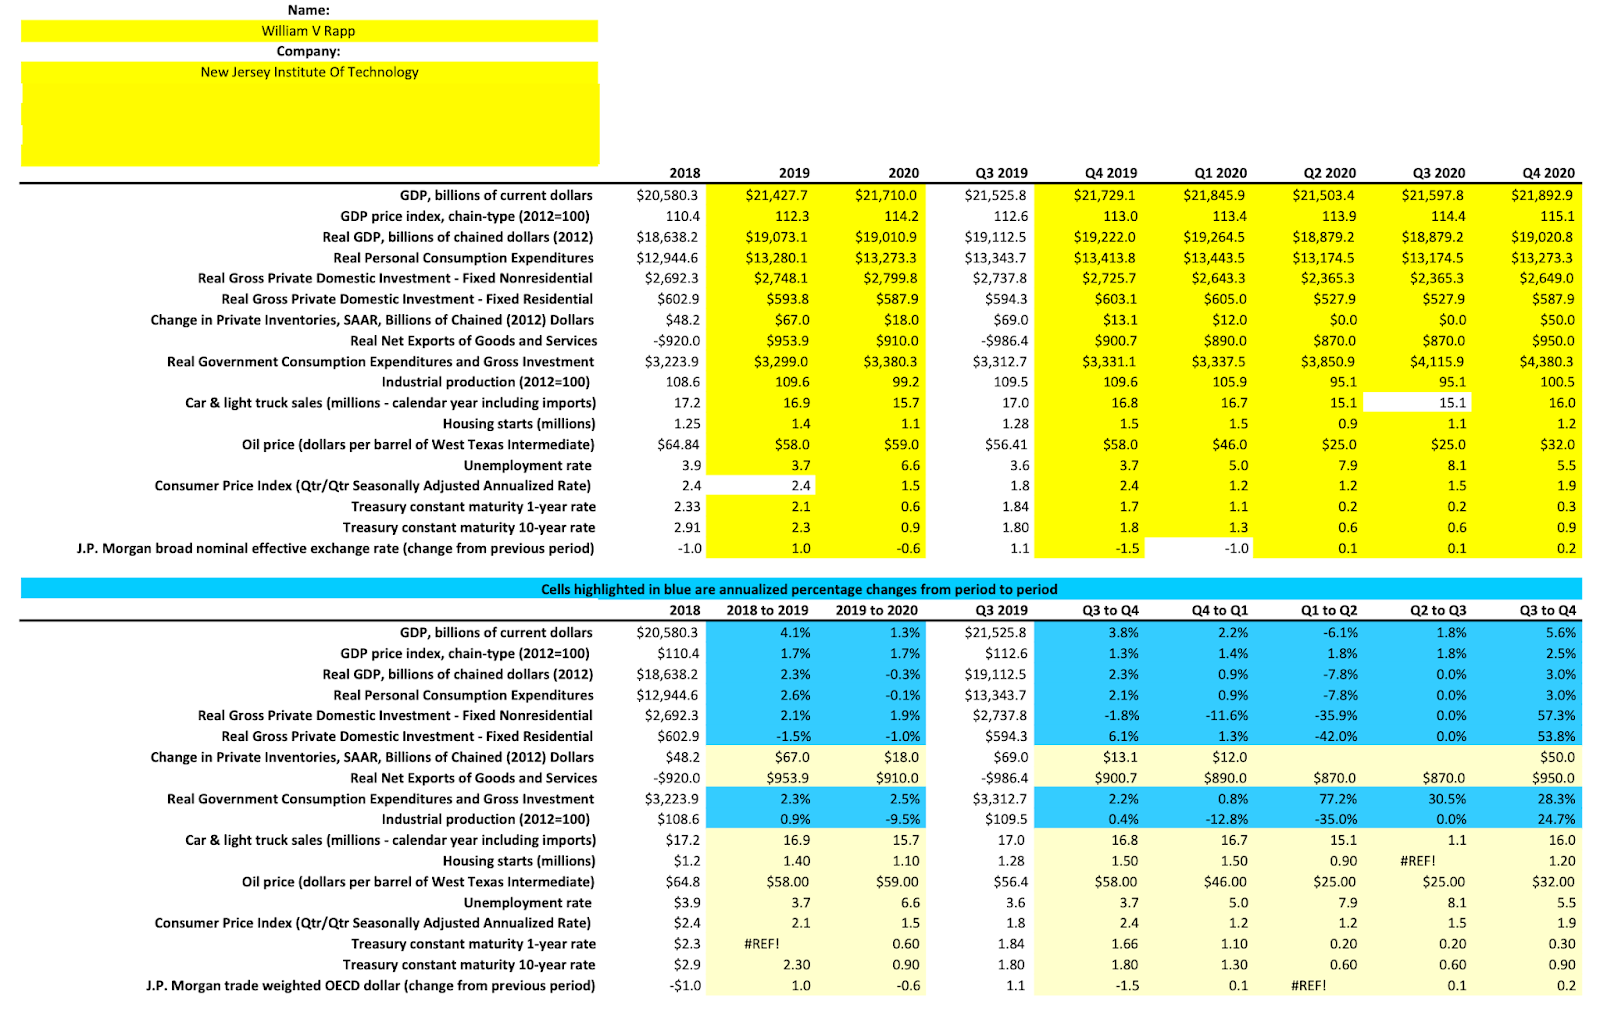
Revised 2020 Forecast
© William V Rapp, Director Leir Center For Financial Bubble Research
Using the Chicago Fed’s forecasting template, I have revised my original 2019-2020 US economic forecast to somewhat account for the extraordinary events that have occurred since last December, seemingly several lifetimes ago.
I have updated the 2019 4th quarter and whole year numbers to reflect what has actually been published and is available from various government and private sources. I have also accessed data available for either all or part of the first Quarter of 2020.
Still projecting forward as might be expected has many challenges. I have tried to base my estimates on a significant downturn similar to the Great Recession but not the Great Depression. I will try to keep these estimates up to date, though, as new data becomes available. As indicated in an earlier blog I am estimating the second quarter to show 7-8% negative growth with a sharp uptick in unemployment. The recent record jobless claims while having some impact with respect to the first quarter were diluted in terms of their reported first quarter unemployment, GDP and consumption effects because they occurred in the last two weeks of the quarter. Their full impact will become apparent in the 2d quarter. The ten million applicants while historically enormous is still only about 4% of the US labor force. But this is enough to double the unemployment rate to more than 7%. Hopefully as the quarter evolves and the large government stimulus plus the large hiring unusual in a recession by firms such as WalMart, Amazon, CVS, UPS and Fedex take hold, the unemployment rate will stabilize in the 7-8% range. I have built this scenario into my forecast.
The most difficult estimate and which will probably require the most revisions is government expenditures. This is because the stimulus programs will take time to ramp up as indicated by the difficult start to the one for small business loans. In addition, different pieces will be going to different states and organizations and the timing of their expenditures is also unclear. Finally, not all elements of the stimulus packages are government expenditures but are loans plus tax deferments and credits. Thus, I have put in about $1 trillion increased government expenditures spread out and increasing over the next three quarters. While I think the timing is about right, the level and ultimate impact on GDP and employment remains foggy. My hope is that as we begin this forecasting venture that it will prove helpful to some and that I can keep my eye on the data and the evolving economic conditions without bias.
Thursday, March 26, 2020
Beware Roundphilia!
William Rapp, Director Leir Center For Financial Bubble Research, © 2020
Often when there is boom, bust or crisis, experts appear with their prognostications as to how high or low the market or other economic factor might go. Not-to-be-out-done if one expert says the market will go to 40,000, as happened with the Nikkei Index in the Fall of 1989, a rival forecaster will say no it will go to 45,000 and the next one says 50,000. These always round number predictions are often indicators of tops and bottoms. In the Nikkei it actually topped out in December 1989 below 40,000 and has never come close to recovering its high of around 38,000. These round numbers generally mean the experts are relying on feel or intuition rather than hard analysis based on actual data. Frequently that feel gets caught up in the emotion of the moment. There is also an element of competitiveness.
While it may not indicate a bottom, recent pronouncements by economic experts at major financial institutions on the coronavirus and second quarter GDP seem to be following a similar playbook. When JP Morgan says it may decline 14% on an annualized basis or 9% above the then consensus view, Goldman then says 24% or 10% more to be followed by Morgan Stanley at 30%. Then to top it off the President of the Saint Louis Fed pronounces 50%. Each escalation must be significant and easy to remember as otherwise the Media would not pay attention. If JP Morgan had said 7% or 8% no one would have paid attention. In this manner they began a worst-case scenario arms race. My own view is more sanguine, though I do expect a recession and a decline for 2020 as a whole.
The reason for this is that many people are still getting paid and spending money even if working from home. Further companies in the delivery business are adding employees in dramatic numbers and these workers want to stay employed, even maybe if they are not feeling well. Unemployment numbers will tell the net loss or addition story first, but I think the Treasury Secretary’s 20% unemployment declaration was more to scare Congress into action than a realistic number. While I am just another forecaster with a few awards and should thus be no more believed than anyone else, I think based on what we know now a case can be made for unemployment rising to a 5-6% range with some mild abatement in the fourth quarter.
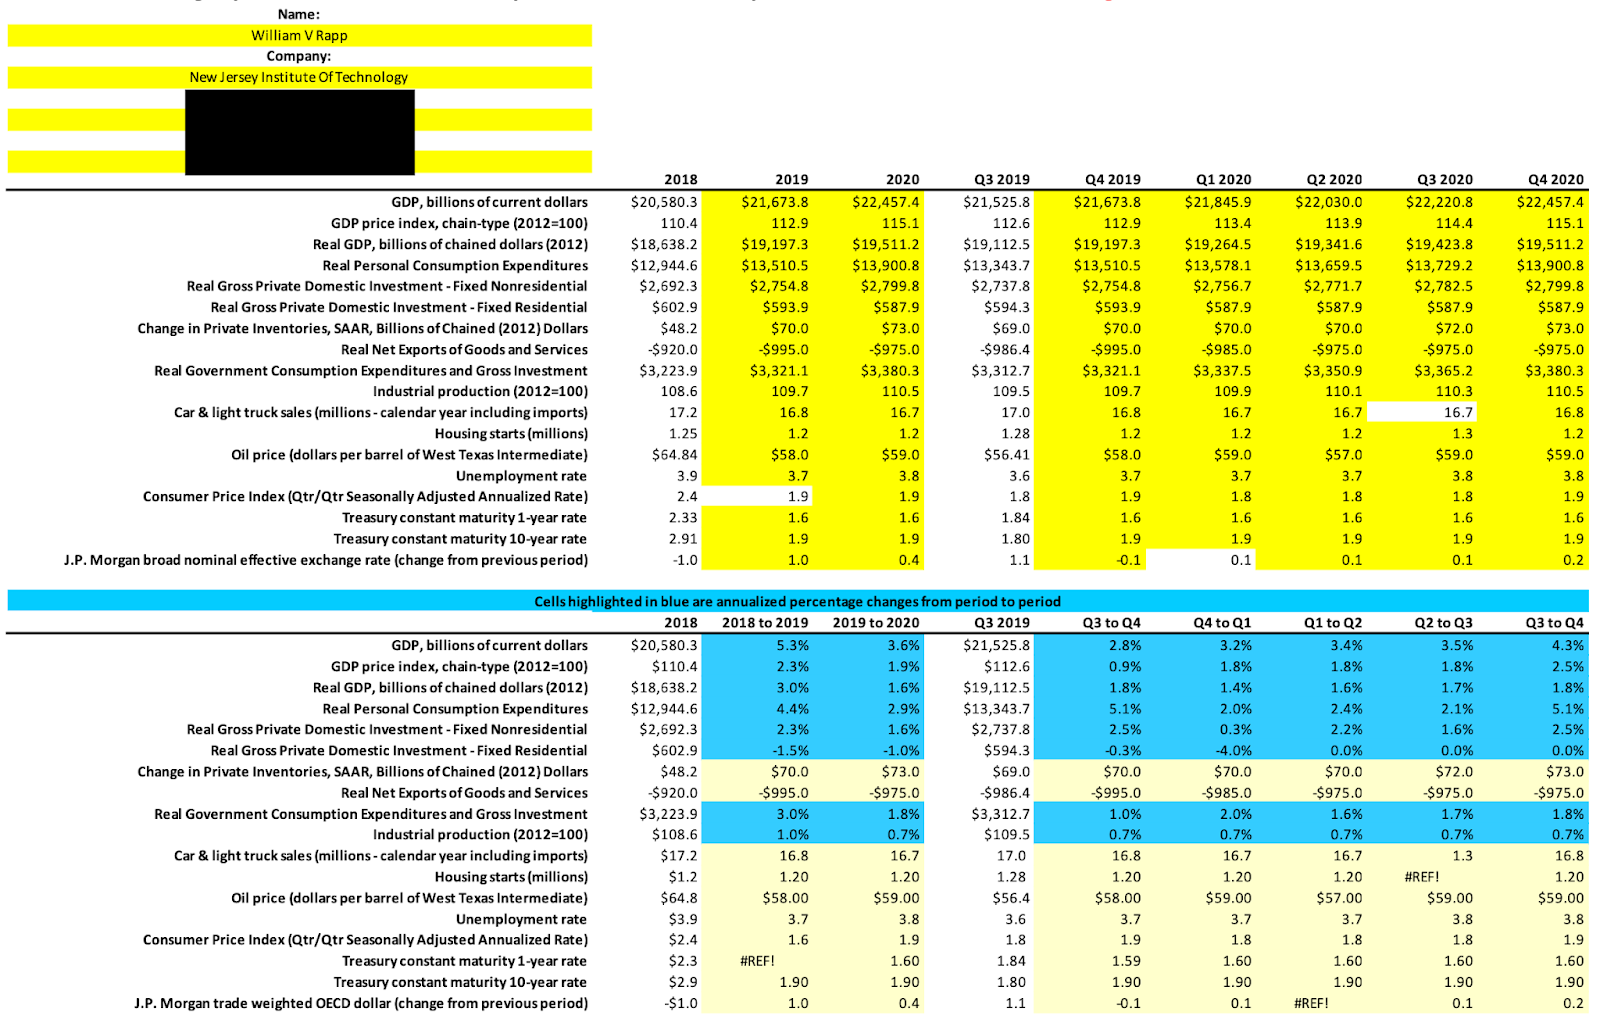
I currently expect GDP growth should be 1-2% negative in the first quarter, minus 5-7% annualized in the second quarter, zero in the third quarter with a 3-4% pickup in the fourth quarter. It will therefore be negative for the year as a whole but end on a somewhat positive note.
Using the Chicago Federal Reserve Forecasting Template, I have set forth my own view of the US Economy for the year 2020 for anyone that might be interested. This forecast will be updated regularly as the situation evolves and will be available on this website.
Thursday, March 5, 2020
Prof. Rapp on WalletHub.com
Prof. Rapp was recently featured in a WalletHub.com piece on SALT. He offered insights on the following questions:
- Do people consider property taxes when deciding to move?
- Should they?
Friday, January 31, 2020
Management Professor On a Roll. Receives 6th Economic Forecasting Award
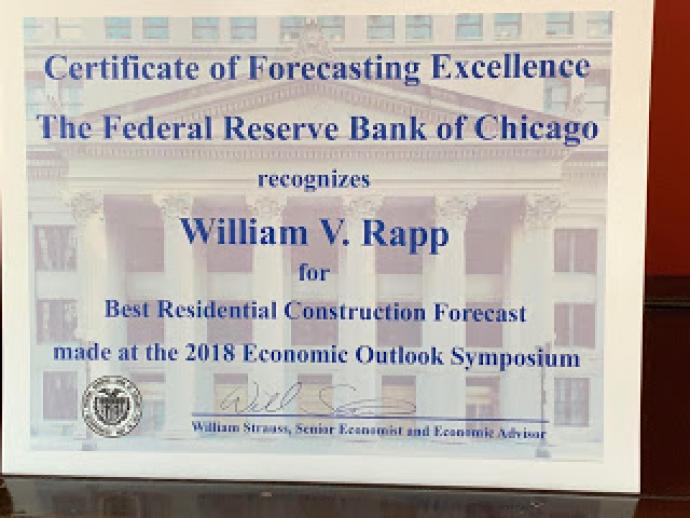
The Federal Reserve Bank of Chicago has once again lauded William V. Rapp, the Henry J. Leir Professor of International Trade and Business and director of the Leir Center for Financial Bubble Research at NJIT's Martin Tuchman School of Management, for his economic forecasting acumen. It was the sixth forecasting honor awarded to Rapp by the bank — this time for his 2019 forecast, which predicted declines in housing construction, and noted the large discrepancy between the Consumer Price Index and the Gross Domestic Product (GDP) deflater.
Rapp was recognized this past December at the bank’s 33rd Annual Economic Outlook Symposium, where he submitted his forecast for 2020. His report, posted on the Leir Bubble Center website, focuses on such sectors as auto, steel, heavy machinery, consumer and employment.
The consensus of the experts attending the conference is that “industry and state economic outlooks generally support an overall GDP macro view of lower but still positive economic growth, with spotty performance in various sectors, especially investment.” Additionally, the outlook for the U.S. is better than that for many other countries.

Thursday, January 9. 2020
Highlights of the Chicago Federal Reserve Forecasting Conference 2019
William V Rapp, H J Leir Professor, Director Leir Center For Financial Bubble Research - New Jersey Institute of Technology
General Economic Outlook As Of December 13, 2019
For the last two years my Chicago Federal Reserve Forecasting Conference GDP forecast, which is posted separately on the Leir Bubble Center website, has been on the lower end of the Conference’s Consensus Forecast. This year, though, my forecast for 2020 is pretty much in the middle, indicating that a majority of the forecasters expect slower US growth. This is significant to the extent that reviewing the history of recent consensus forecasts against actual results the Chicago Fed showed that the consensus forecasts have been pretty much on trend, though they have missed the increase in economic volatility. The primary reasons volatility increased in 2019 were the weakness in industrial production and investment and this fed into lower than expected inflation, interest rates, and oil prices, which probably helped the star performer that kept 2019 GDP on track, Consumption.
However, the Real GDP Consensus for next year is for only around 2% growth in consumption and other data points also reflect lower growth with some forecasters looking for zero growth for middle of the year. Investment could come back but will still be below 2%. At this rate it is not clear that Investment will cover depreciation and obsolescence, which should be worrisome if one is concerned about the burning of capital as reflected in negative interest rates and collapsing unicorns. $60 or relatively flat oil prices are expected, though this will depend on more recent events in Middle East de-escalating. An expected CPI around 2% is consistent with this view.
No one sees inflation that would worry the Fed – thus interest rates are also predicted to be flat. A relatively steady monetary policy is thus the consensus view. Light vehicles are projected at 16.6 million units and housing at 1.28 million units. Unemployment is expected to rise slightly.
As just indicated the key difference between the 2019 and 2020 forecasts is that the consumer sector which has been carrying the economy in now structurally weaker. Contributing factors are: a shorter holiday season, a mood of uncertainty among Consumers, and weaker than usual consumption increases related to housing that one would expect with ultra-low interest rates. Nationalism and populism increasing worldwide is also worrisome and negatively impacts prior positive boosts from globalization. It was also noted that with respect to employment in 2019 healthcare was only source of growth partly due to the increase in population over 80 but also the ACA, which is now under legal attack.
Other structural issues hurting employment growth include shifts from retail, which is falling, to employment related to internet sales which are rising. Yet same day delivery faces both labor shortages and in cities major delivery issues. Further while wages at the very low end have seen a strong uptick from increases in state and local minimum wages, this has not occurred at the managers level. Thus, wage increases are reflecting a water-wing distribution. Other structural issues impacting wages in multiple directions are due to technology, shifting population and changing consumption patterns. Indeed, increased unemployment and also underemployment for new college graduates over 2019 summer is worrisome. This could exacerbate the problem of managing student loans and thus the new graduates’ ability to take on more credit card debt much less auto and housing mortgages that feeds back to weakness in these sectors and thus depresses the cash flow required to keep a circular economy growing.
Adding to these headwinds are that the trade war will not be short term but is in reality the first round of what is likely to be a generational confrontation by the US with China. Thus consistent with the slower growth forecast, year over year job openings will fall and this will negatively impact consumer confidence which index is already down a bit, and any large negative news shock could be a problem. Since growth is expected to be positive, if low, one could say the Conference was cautiously optimistic and increases in mortgage refinancing that might lead to a boost in related consumption such as furniture, appliances, home improvements, home services, and repairs would be a plus. On the other side various indices indicate uncertainty continues to go up.
Outlook Specific Sectors
Autos
While the auto market continues to see a decline in demand, the real story is the major changes impacting the supply base and this is not just in the US but globally. Everywhere suvs, crossovers, and awd vehicles are replacing traditional sedans with the impact of electric vehicles [EVs] still an unknown autonomous factor. Since China is largest market in the world. It and not the US will drive suppliers and innovation, which one can see in GM’s 0-0-0 strategy. Electrification begins with hybrids which assist in starting-up process, saving gas, and the rest of the world is heading more and more to electrification while North America still stuck in gas driven by US light vehicle sales [80% of the North American market] and its massive shift from sedans to suvs, trucks, crossovers. This means the NAFTA producers will lose scale and its parts suppliers will fall behind. This will also affect exports.
Meanwhile competitive compulsion will push producers into more advanced technologies with the primary marketing wars between level 2 & 3 safety features. Platforms will also change due to different engines and transmissions, reflecting multi-propulsion systems. In this context capital allocation will favor wealthier tier-1 suppliers where some OEMs such as Toyota will now be competing. The global market will respond to two different growth drivers. In Emerging Markets it will be income but in advanced economies it will be driven by GDP growth.
Oil prices should not be an issue between $50-70 but regulations and climate change will be drivers. So it is important to note that the US may be 5 years behind the rest of the world and is thus falling behind in the new technologies. Also, the rest of the world will be able to introduce new ideas and technologies faster as indicated by Tesla’s rapid gearing up in China. The challenge for US parts suppliers will be even greater and represents a market structure risk. Offsetting this somewhat is that several leaders of the auto technology revolution such as Toyota, Honda, Google, Apple, Tesla also have a large North American footprint.
Yet it is expected that the big growth in auto demand will be in China and Southeast Asia. So OEMs and parts suppliers will need to find scale globally. This means more strategic partnerships are likely at all levels such as VW and Ford. It was also noted that this has and will lead to higher inflation rates for autos, which then is a problem if wages going up at a CPI less than or equal to 2%. Another hot demand area reflecting structural changes in the global economy is Cargo Vans due to increases in short haul delivery by Amazon and others and the GM strike did not heavily impact GM sales as they built ahead.
Sales forecast for 2020 is a slight uptick to 16.6 million cars and light trucks and 16.7 million in 2021. The biggest threat to these forecasts is regulatory trade boundaries. This has regional impacts due difference in locations of foreign investment in the South rather than Midwest [8MM versus 6.5MM]. Alternative fuels also may come more slowly than expected due to large infrastructure expenses associated with both hydrogen and electric, though it will vary by geography with Germany and Japan targeting fuel cell and hydrogen while China is targeting electric. What is clear is these cars will last longer.
Steel
The presenter from Arcelor-Mittal, the world’s largest steel producer with about 100 million metric tons of capacity was even less upbeat. About 50% of its production is in Europe and 25% in US neither of which is showing dynamic growth demand for steel. So even though it now has a new JV with Nippon Steel the world’s technology leader in flat rolled steel and is the largest US producer of flat rolled steel, US demand has not yet recovered to where it was before the Great Recession [GR]. Even for 2020 A-M only expects recovery to 8% below the average during the 10 years before the GR.
This is also affecting Imports, which have run 20-29% but this year are lowest since 2003. Thus, tariffs and trade investigations [section 232] have had their impact on the industry, though, it was noted that various exceptions such as Canada have diluted the effect of the 25% tariff.
The World Steel Association has data on global producers. China is massive with capacity six times the next largest which is now India in 2d place, pushing Japan and the US to 3d and 4th respectively and exports have also fallen significantly due to the massive overcapacity and the tariffs. Also worrisome is the fact the industry is not able to achieve the 80% of capacity needed for sustainable growth. Tariffs helped initially but the resulting fall in sales of equipment using steel knocked the industry back below this key level. There is weakness in demand both for production and inventories. But inventories are now so low it indicates there should be a pick-up by service centers beginning 2020.
Key steel markets one needs to watch are construction [44%], auto [28%], equipment & machinery [9%], and energy [6%]. Therefore, drop in steel demand reflects the lower investment and inventory levels cited above in the GDP review. Only recovery in construction due to low interest rates and low housing inventory is a possible bright spot. There seems to be some disconnect, though, between the construction outlook [+] and data for machinery inventory and demand [-] which would be used in construction unless existing capacity is viewed as sufficient. Solar and wind [energy renewables] that use steel in their construction is also a possible contributor. The WSA prediction for steel demand is a 1.8% increase worldwide, 0.4% US, 1% in China 1% and then India. Infrastructure could be a real bright spot, but lack of funding and politics are major obstacles.
A question about Chinese steel profitability generated the response that higher iron ore prices and low steel prices did not favor China’s blast furnace production compared to US using scrap or electric arc or mini-mills.
Heavy Machinery
ACT Research tracks the capital goods expenditure environment. It currently sees global weakness and possibility of a recession that has both depressed demand for these goods and may contribute to a recession’s occurrence. It was highlighted that the Fed’s manufacturing index has underperformed consumption and the growth in GDP. Indeed, it has been negative in 2019 and is thus consistent with the economic slowdown expected in the Consensus Forecast.
It was then explained how the positive outlook at beginning at 2019 became less positive over the year especially due to trade uncertainty, the tariff wars, and oil price volatility. Therefore, it is not surprising SMEs are now less optimistic and durables consumption went from 3% growth to minus 2.2
NA Industrial Consumption is down 2019 5.3%, where a range of industries had good growth in 2017 and 2018 but in 2019 became flat to negative. Warehousing has been an exception up until the last few months. Exports play a big role in this scenario. Oil & Gas Equipment reflects the lower prices and over-supply in this sector while heavy trucks had demand blip up in 2018 and disappear in 2019. A 30% decline is seen for 2020 due to electronic tracking and logs that have largely eliminated cheating on mileage and hours. Buses and other trucks will be down about 10%.
2020 will be an OK world but for machinery it will be treading water. India and China are still question marks as their data is not completely trustworthy, especially given trade issues that may persist and cause customers to continue waiting until things become clearer. It is this uncertainty that is at issue since debt and funding are both available and adequate. Indeed, if the economy can dodge a 2020-2021 Recession then it could have a real record long-term expansion. In this respect 2019-2020 could be much like 2015-2016
Chicago Fed’s Survey Of Business Conditions Across 5 states
Indiana, Illinois, Lower Michigan, Southern Wisconsin, Iowa
Illinois Fiscal Outlook
For first time Illinois has a real budget where the state is not fudging numbers especially as to its pension obligations. Two other positives are 1) the state administration and the legislature are looking for new revenue sources and 2) the state now has an infrastructure budget. One big problem remaining though is the state has $6.5 billion in unpaid bills, mostly to various medical providers. Further nothing has been done to address the unfunded pension liability where it ranks 48th among the 50 states. So while this situation is also true for many other states, IL was in trouble even before the Great Recession unlike many others.
Pension obligation bonds which were issued to partially address this underfunding were not all invested and thus did not really create the intended arbitrage. Further effectively taxing villages through reduced state aid also did not work. The most viable solution remains a graduated income tax as a replacement for the current flat tax. Increasing taxes would not make IL the highest in US but it would move significantly up in the rankings. In addition, having a plan is a positive. Another alternative is to not have fully funded target but something that is sustainable out of a certain percentage of annual revenues, though IL’s funding is still too low.
A recent decision by the Illinois Supreme Court has forced the state government to maintain pensions promised but it does not limit the way raise revenues. So it could follow NJ which dedicated its Lottery. It could also expand sales taxes to services and the income tax to some pension income. A high state property tax is also possible. Under that approach one would know how much is owed and the amount raised can be estimated fairly precisely. It is fair since wealthier people will be ones paying more and it would be limited to the time needed to fix the pension problem.
Having pension managers take on more risk to achieve a 7.5% target return comes with very much higher risk and complexity and thus defies prudence. Still this situation is partially the result of excess capital and ultra-low interest rates. In 1995 a 7.5% target return could have been achieved all in bonds with only a 6% standard deviation. By 2005 the same return required 56% in bonds with a higher standard deviation. In 2019 it was 12% bonds and a 17% standard deviation using a complex investment strategy.
Once the state decides it fiscal path it will need 3 budgets: Cash, Pension, Capital to give the public full transparency. This should help its bond rating which is currently the lowest in the country since the Rating Agencies have focused on the fact it has no plan.
Still it has recently successfully issued bonds at competitive rates due to the shortage of tax-exempt paper.
Summary
Industry and State economic outlooks generally supported overall GDP macro-view of lower but still positive economic growth with spotty performance in various sectors, especially investment. Thus, US should muddle through 2020 and in the process do better than current outlook for many other countries.